Old-School Computer Vision to Extract Baseball Stats
Table of Contents
Introduction
During the COVID-19 Pandemic, a friend of mine started running a virtual baseball season simulation to fill the void when the MLB was shut down before agreeing to the shortened season. He approached me to look to see if we could use devise some OCR solution to automatically extract the stats from the top player screens. The intention was to steamline getting this information since it was being done by hand. All code for this project can be found here.
The Problem
I narrow down the task to extract the characters from the specific game screens and leave automating around the game for another day or coder. I was given a screen capture of the desktop with a window displaying the game screen:
Data
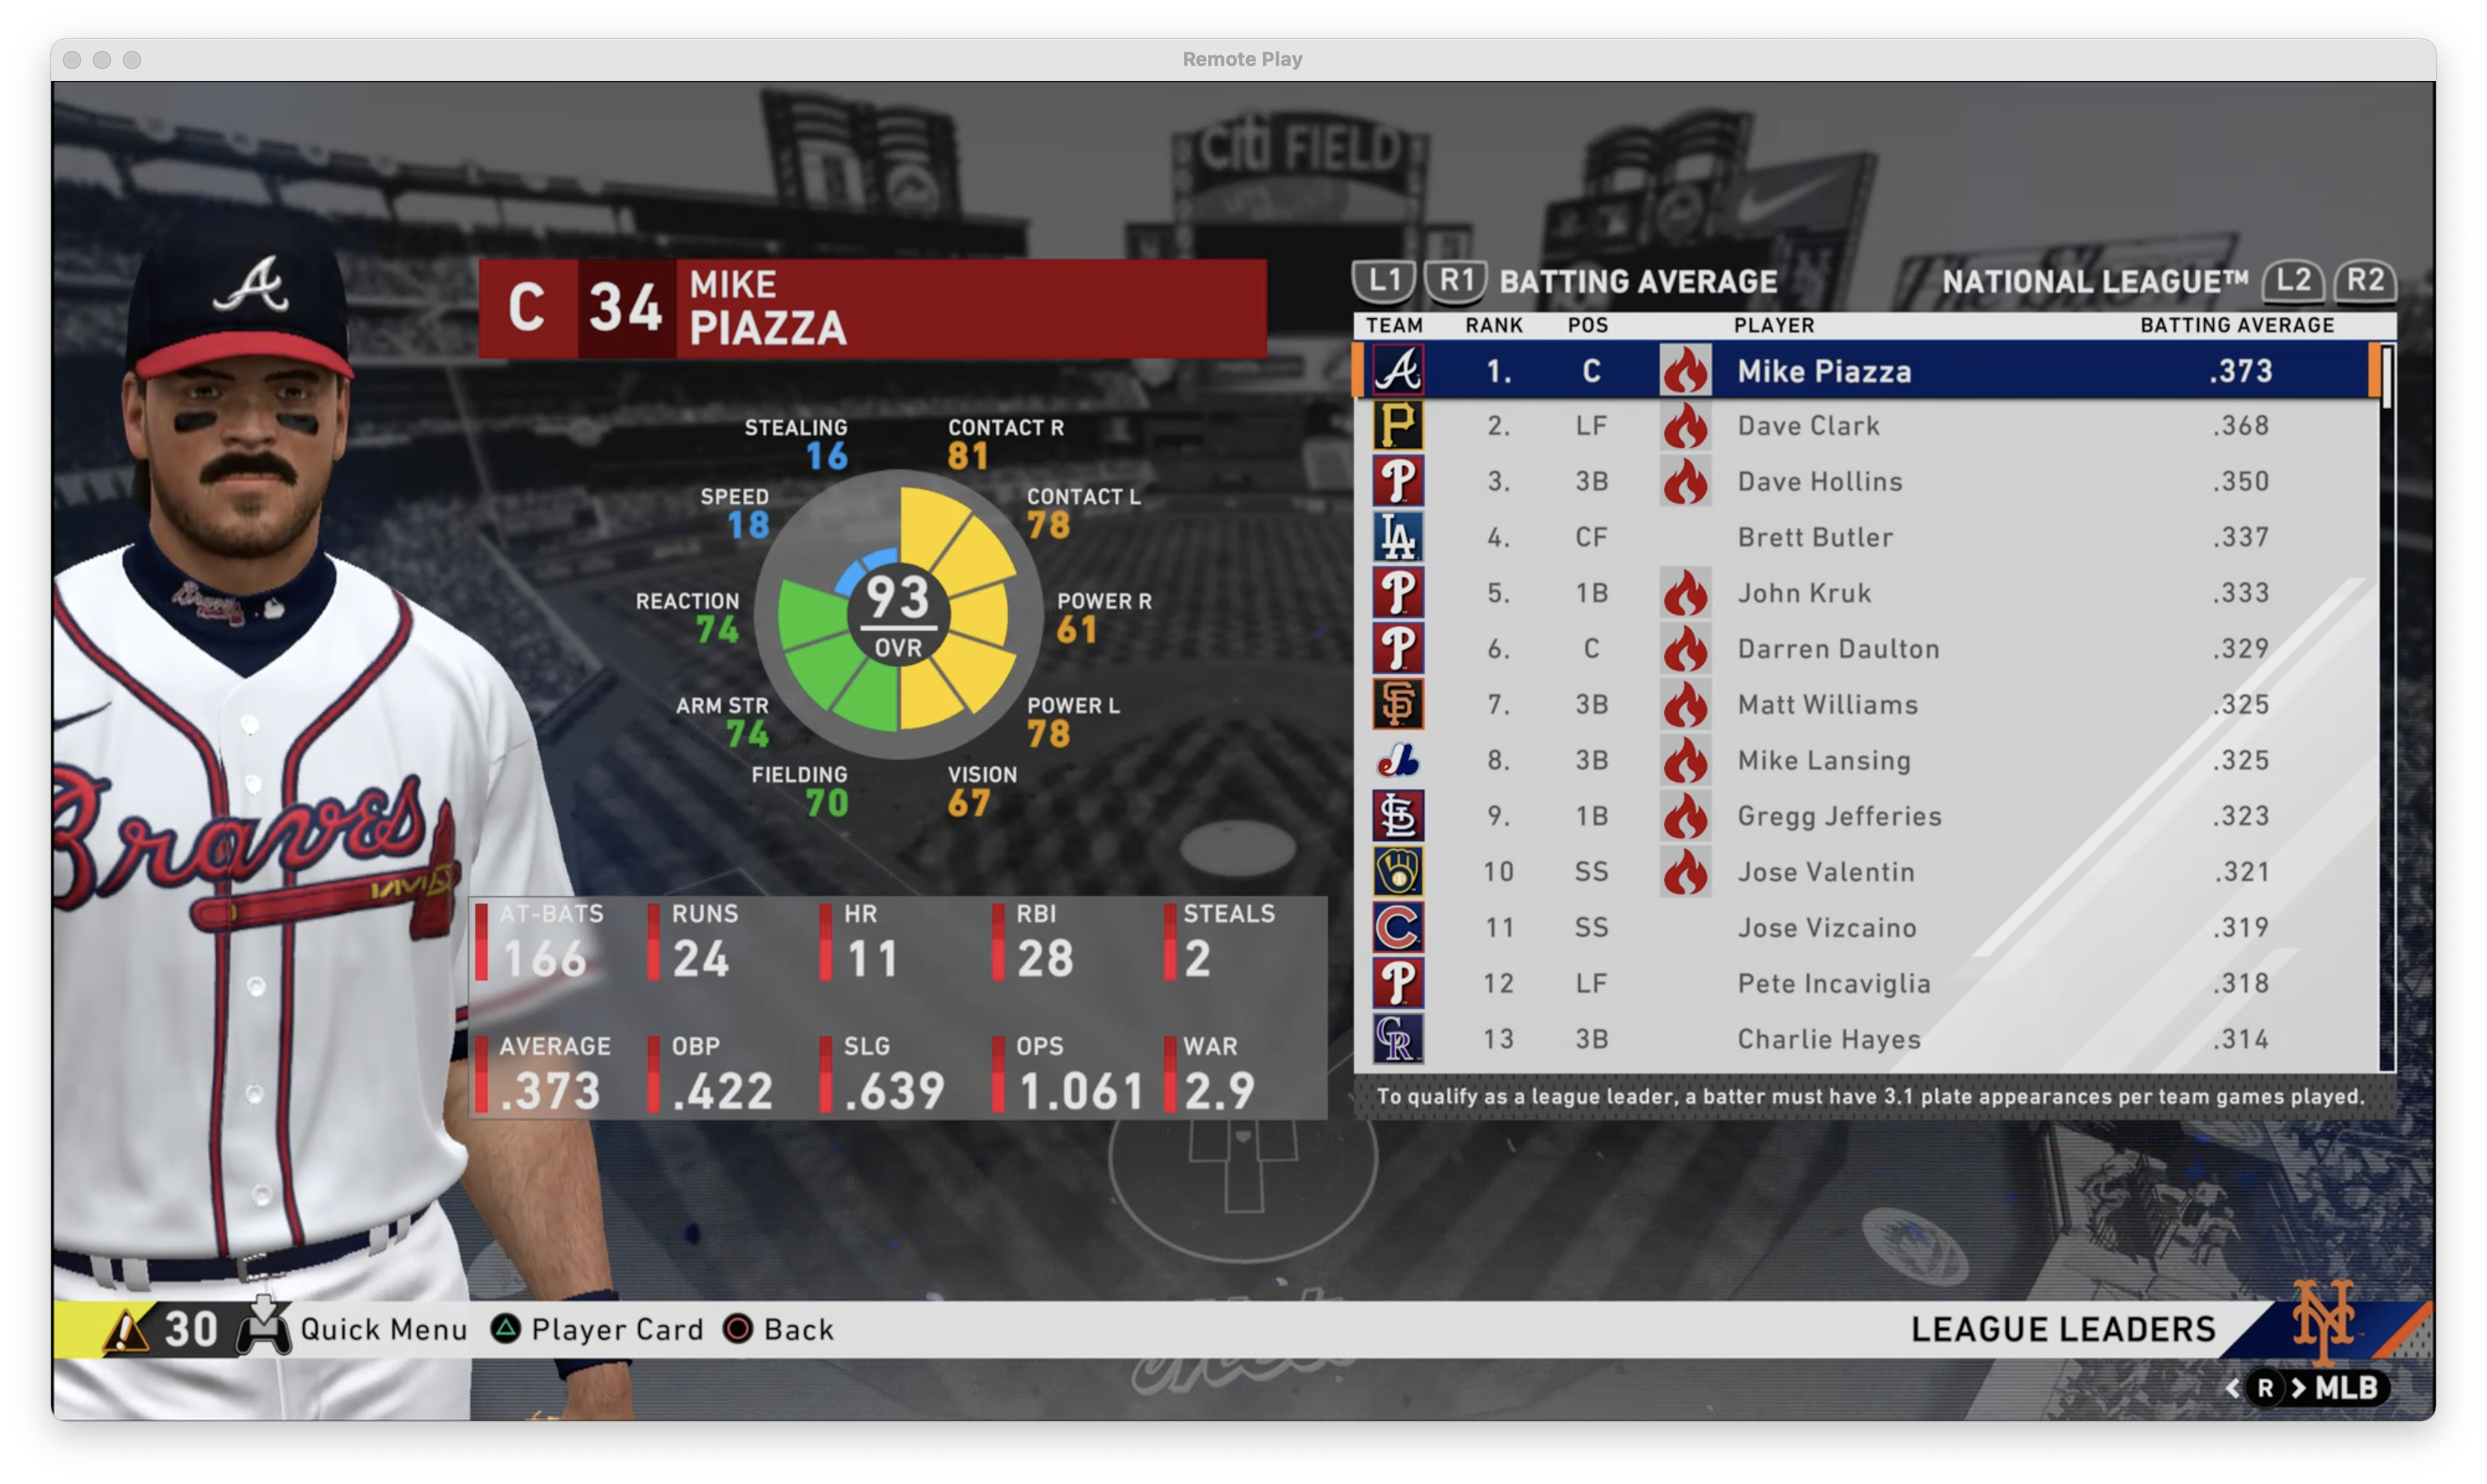
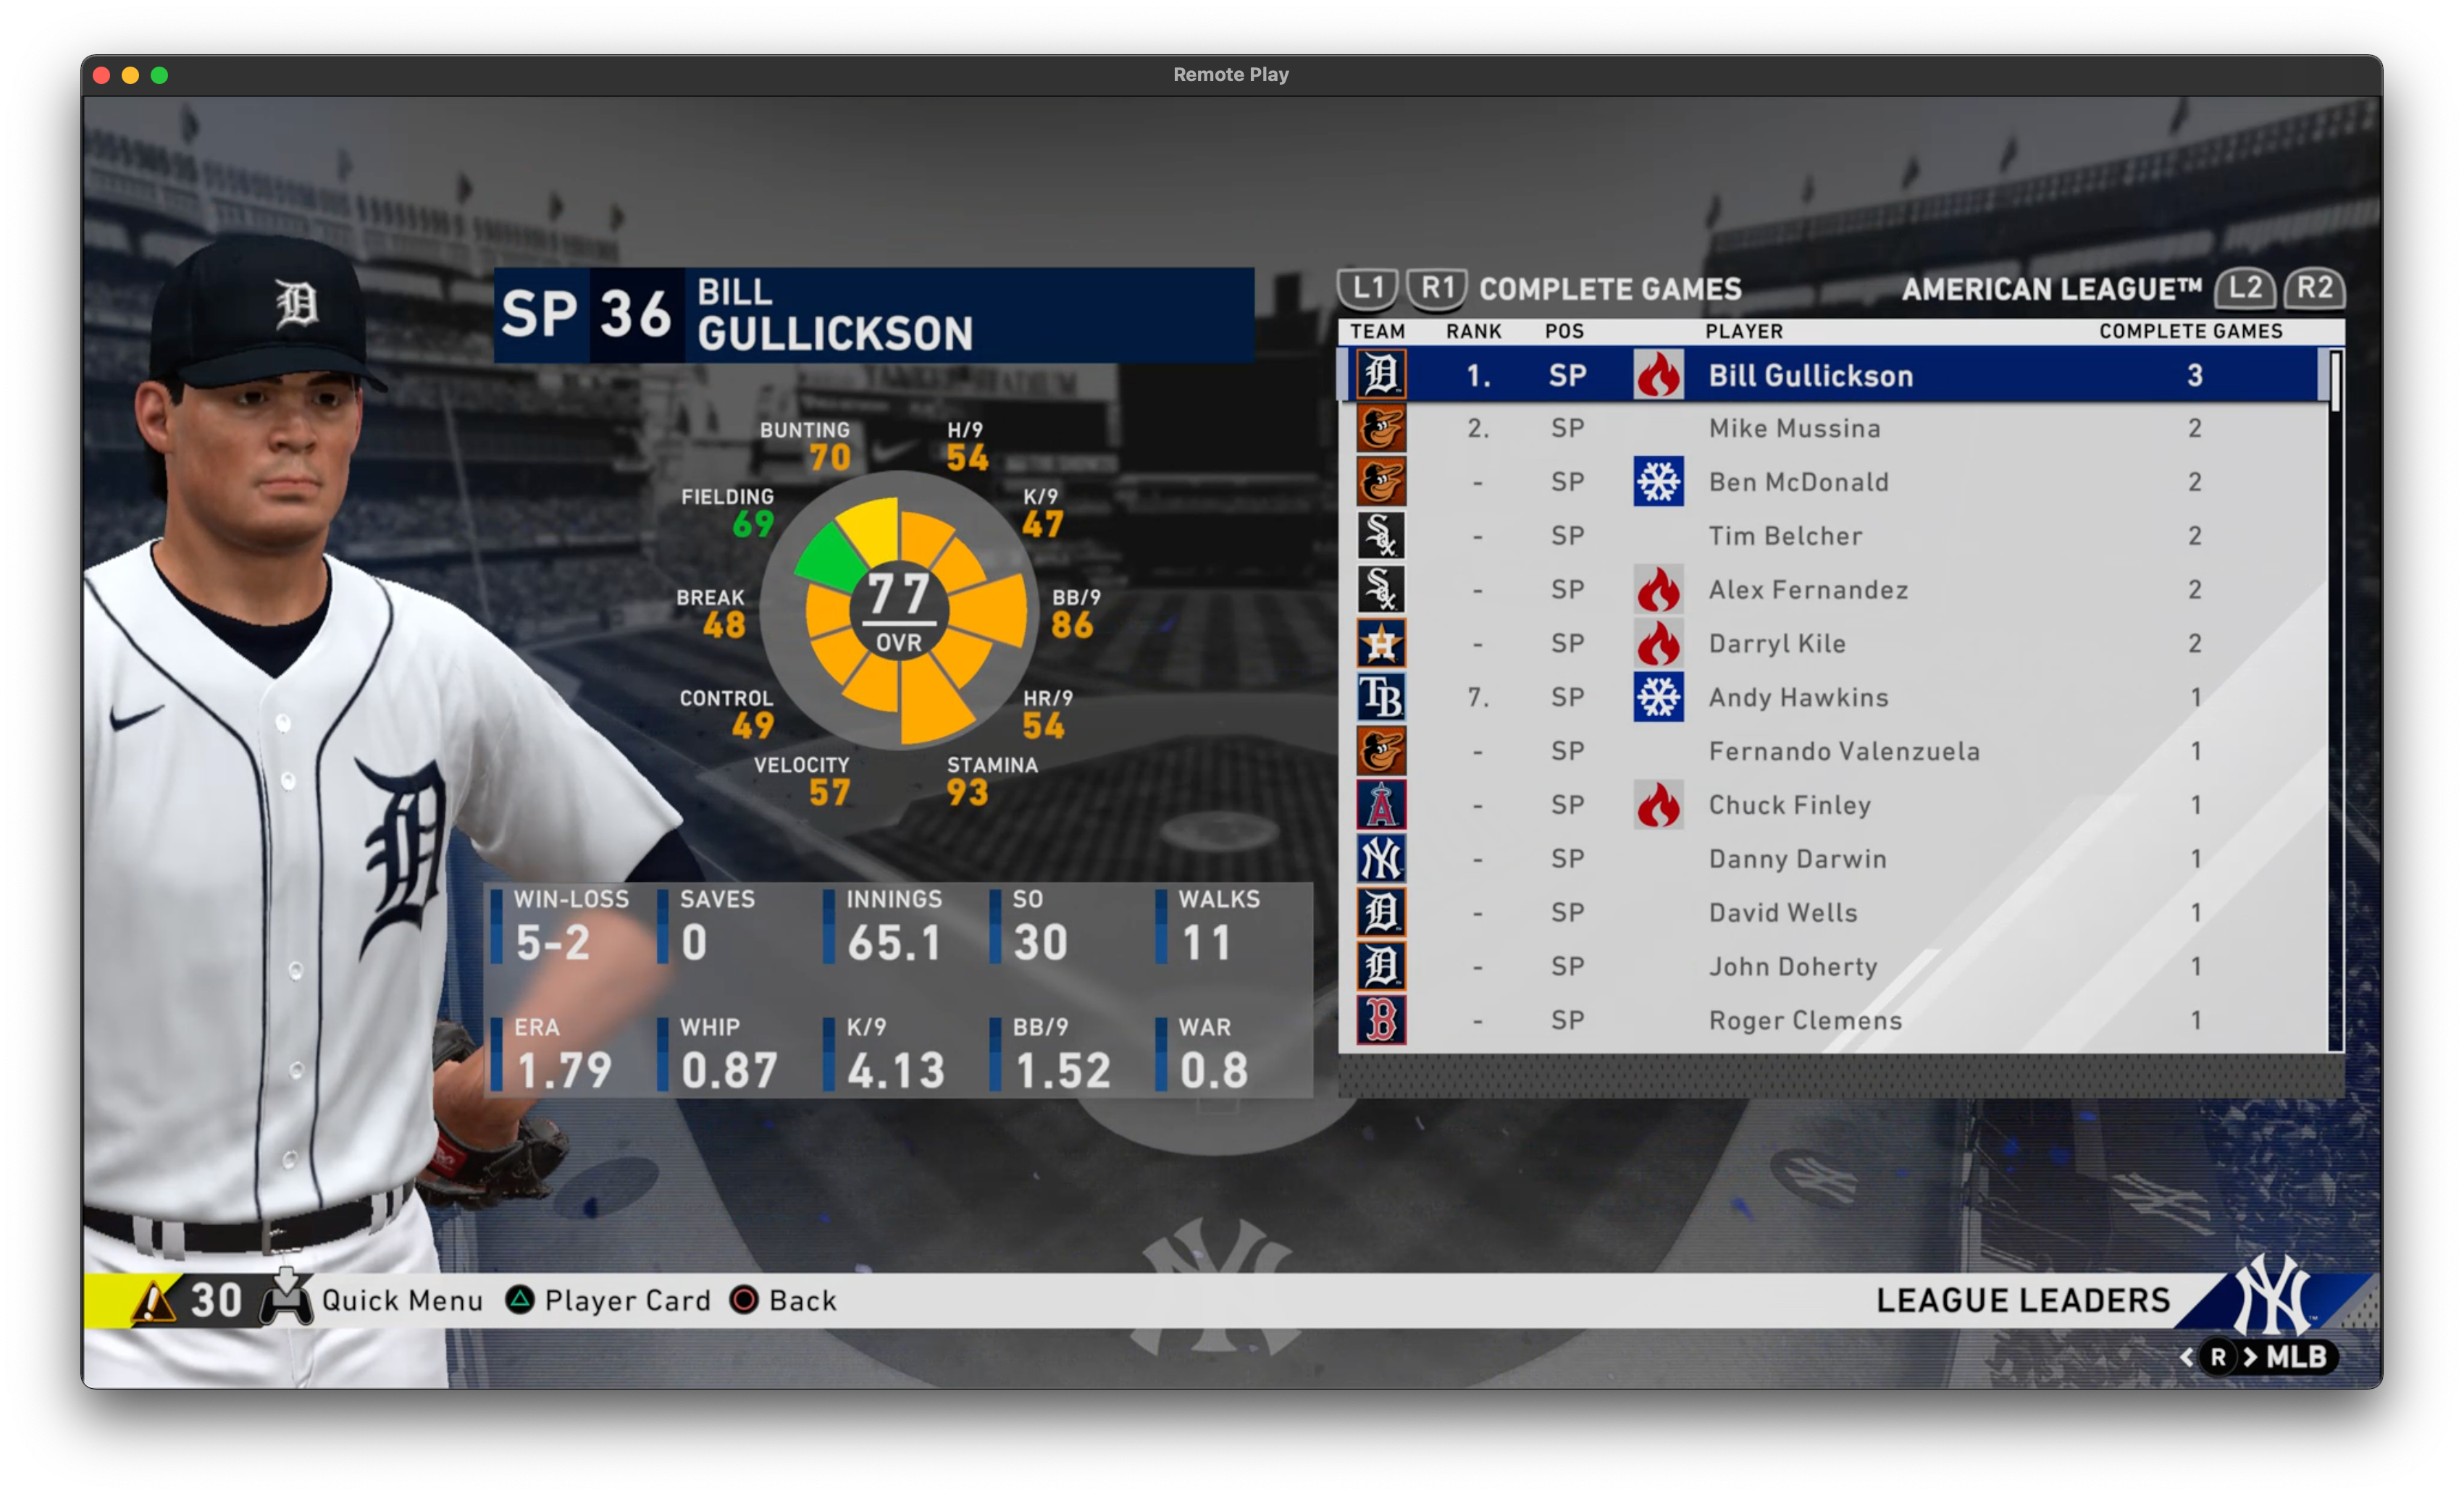
One problem is that this is not a lot of data. The variance in pixels means we shouldn’t be precise in the pixel locations if we choose to crop or make decisions based on x-y location of objects, especially if this is not a completely accurate representation of the capture method (I think a production version would work directly on the screen capture, not multiple layers of screen capture on a Mac). Another problem is we can already see that some variation with players being displayed behind the stats could cause some issues with filtering techniques.
Solution
I chose to use more traditional computer vision techniques instead of directly going to deep learning. While we may get good results using something off-the-shelf for OCR, I wanted to keep things simpler. We make the assumption the user will crop to the stats panel as an input to the algorithm. Given the input image, we transform it to grayscale, apply pixel value thresholding, and do some minor morphological cleanup. We then used connected components to group pixels into blobs that should be characters. Given these groups, we crop them and classify them with features that we come up with from the characters in the data images (that we split into training-testing sets). The output should be the stats with the appropriate headings depending on the input being a pitcher or non-pitcher because the stats are different. Many of these techniques required some hand-tuning, and I kept those experiments in an ipython notebook. The final script is extract_stats.py
Extracting Characters
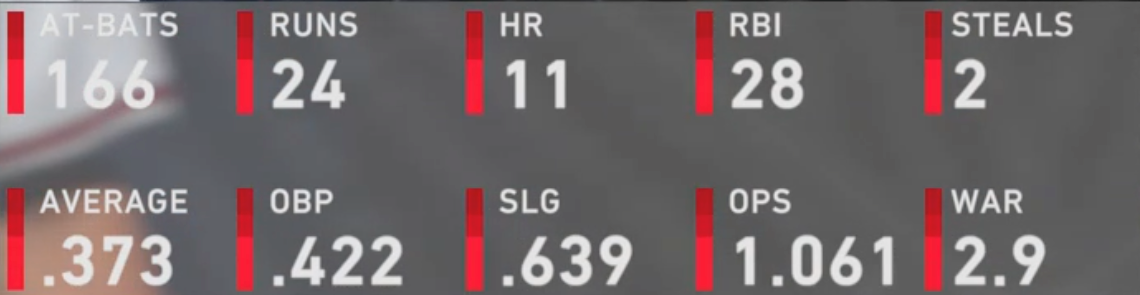
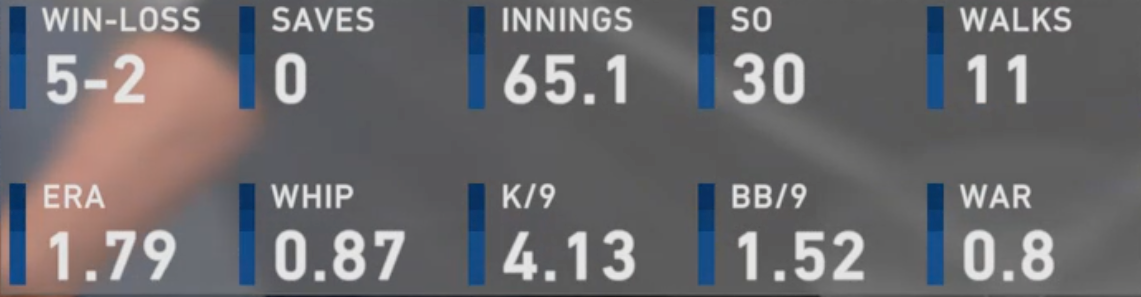
We extract characters with fairly conventional techniques. We first crop to the stats panel. We do not automate this as we expect the user to set this crop region that can be reused on a batch of screen captures.
We then use binary thresholding to get this:
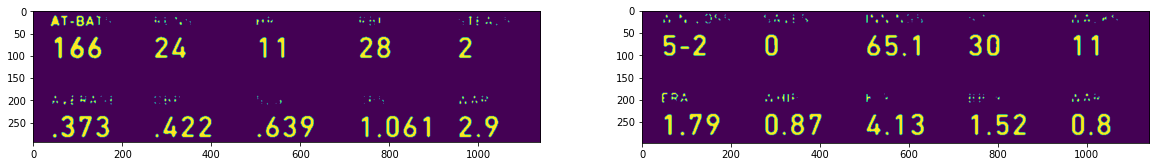
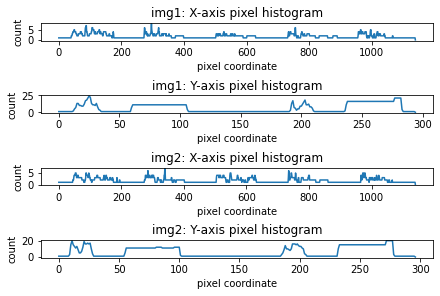
We use connected components to get character blobs, and we create a histogram of thresholded pixels. We can use the histogram to make a decision of splitting up. We filter for the large number characters (and ignore small text as we have other clues to figuring out if the panel is for a pitcher and non-pitcher).
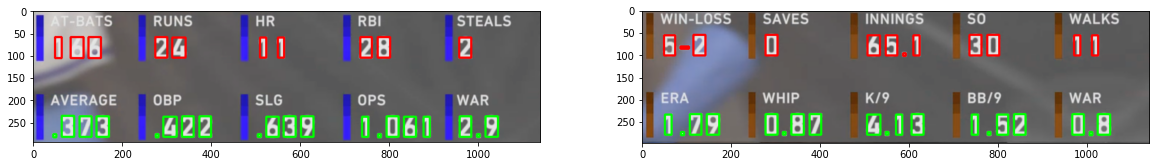
And we finally get a bounding box from these pixel groups:
Simplified OCR
With the extracted characters, we want to classify them as 1 of 12 characters (digits 0-9, “.”, “-"). We approach with a sort of decision tree. There are 2 features we consider: character relative dimensions, and occupancy grid. Character relative dimensions is our first filter where we can classify outright as a “-”, “.”, or a 1. This feature is calculated as the height of bounding box divided by the width of the bounding of the character. The 3 classes we classify outright have a strong correlation to this feature, but the digits 0, 2-9 are too similar to differentiate well. We then search for another set of features to classify.
Digit Classifier
While we call it an occupancy grid, we essentially are performing a downsampling of the cropped image to a 10 x 3 grid. We then compare this downsampled, cropped image to an example of each character. Both images use a binary set of {-1, 1} instead of {0, 1}. We then perform a dot product between the cropped image to each example as the comparison. The values ensures shared values indicate higher similarity and mismatches reduce similarity. We pick the class that has the highest dot product value as similarity. The classifier code can be seen in classify.py
Future Work
The code was shared on github and made available to friend to try out. As far as further automation, this code can be used in a larger automation system to capture the images, and some work can be done to handle OCR of more text characters and work on automatically extracting the player’s name as additional output data. I would also think that further testing would need to be made. Two images may not be enough to have picked the right tuned values for some of the filtering stages. For example, we had to tune to the alpha blending of the player behind the panel, and we did not have enough data to test against variations of skin color and jersey that could disrupt some stages of the algorithm.